
News J-WAFS Newsletter Highlight: Water Management
Global Risks, Local Solutions
Anjuli Jain Figueroa, PhD candidate MIT Department of Civil and Environmental Engineering, MIT June 7, 2019
Risks of Virtual Water
For nations without sufficient or reliable local water sources, the global market can be a ticket to food and water security. These nations import food and goods, and in doing so, access “virtual water” (see part one of this series: "How much water did you eat today?"). The growing inter-dependence of nations through the virtual water trade, however, poses new risks. Current resource management regimes may not be adequate in the context of increasing climate uncertainty and rising populations, putting pressure on water supplies even in places where they are currently abundant.
J-WAFS PI Dr. Kenneth Strzepek researches the complexity involved in these trade networks. He explains the effects of virtual water like this: “If you’re not self-sufficient, if you’re importing, you’re at the will of the market as well as the political pressures from the country that you’re importing food from.” As climate change brings more extremes in precipitation and drought, understanding the virtual water network can help nations understand their risk, dependency, and impact to other regions.
The Color of Water
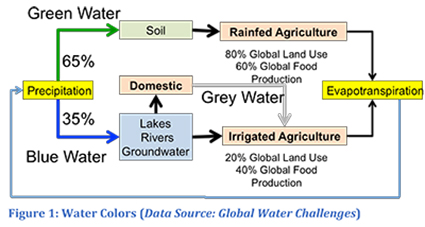
After it rains, water can take two main paths: green or blue. If the crops grown are rainfed, the water source is considered green. If crops are irrigated from river or groundwater, the source of water is considered blue. Grey water is recycled or reused water after domestic activities. (Data Source: Hans Schreier, 2014, Global Water Challenges)
Virtual water and water footprints tell us how much water is used in the production or consumption of food and other goods, but the impact of the water footprint depends on where and when the water is taken. To enhance the concept of virtual water, Falkenmark and Rockstrom (2006), globally renowned water and sustainability experts, developed a color code using green, blue, and grey to categorize water sources. This concept suggests that after it rains, the water can take two main paths: green or blue (Figure 1 – Water Colors). If crops are rainfed, the water source is considered green. If crops are irrigated from rivers or groundwater, the source of water is considered blue. Grey indicates water that is recycled or reused after domestic activities. The green/blue distinction helps illustrate that nearly 80% of global cropland is rain-fed, and distinguishes regions that are overly dependent on blue water from those that receive sufficient rain. Blue water may be subject to overuse and depletion if it is diverted or withdrawn at a greater rate than natural replenishment.
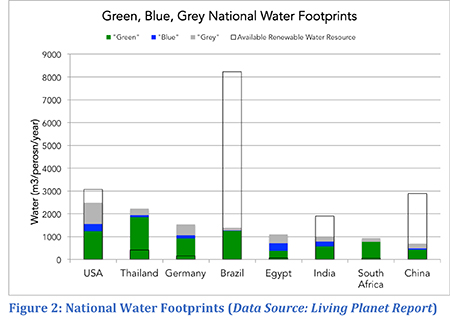
The green, blue, grey per capita water footprints for selected nations are shown for year 2010. (Source: Gawel and Bernsen 2013, Living Planet Report 2010)
National Footprints
In regions with plenty of rain and renewable water, a large water footprint may not have much adverse effect. However, a growing footprint in regions that are already water stressed can result in water problems, including drying rivers and underground aquifers, loss of habitat and biodiversity, and change in local economies (Figure 2 – National Water Footprints). The US and China have a similar renewable water resource base, but the water footprint per person in the US is much higher than that in China. Thailand also has a very high water footprint, but it is a wet country and mostly uses green water. A nation using a lot of water that originates from a water-abundant region may not be cause for concern, but those that overuse blue water may be exacerbating scarcity locally and elsewhere.
Environmental Impacts
Many water scarce regions are starting to see the negative effects of their growing dependency on blue water as their rivers run dry and fail to reach their deltas. Perhaps the starkest evidence of water overuse for irrigation is the desertification of the Aral Sea, once the fourth largest lake in the world (Figure 3 – The Aral Sea).
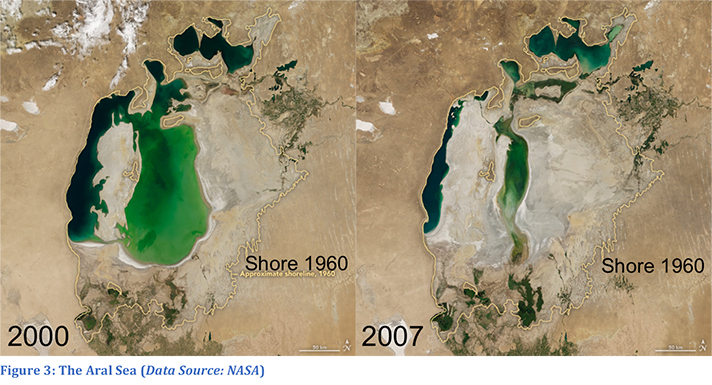
The Aral Sea in Central Asia began disappearing in the 1960s because of the diversion of its feeder rivers for agriculture. Poor water management and unintended consequences show the drastic change even between recent years (2000 and 2007). (Source: NASA)
The Soviet Union’s push for self-sufficiency in cotton production led to expansion of irrigated farmland. Water pumped from the lake to irrigate this farmland essentially left the region in the form of virtual water in the cotton that was grown. As a result of this (mis)use of the Aral Sea, the region has experienced the degradation of deltaic ecosystems, salinization of remaining water sources, pollution, falling water tables, health impacts, loss of jobs, and the displacement of over 100,000 people. Experts (Micklin 2002) now believe it is one of the worst ecological disasters of the latter half of the 20th century. This makes one wonder: How many cotton shirts is the Aral Sea worth? (Figure 4 – Water for Shirts). Some popular press outlets (Conant, 2006) discusses the “Return of the Aral” but the costs are high and return to historical levels seems overly optimistic.
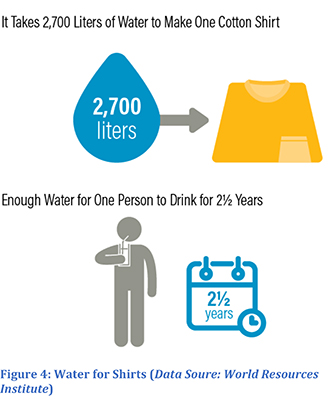
Production of one cotton shirt requires nearly 2700 liters of water. (Source: World Resources Institute)
Paradoxes
The concept of virtual water, particularly in water scarce and agriculturally productive regions, can shed light on a nation’s vulnerability to water shortages in different regions, sometimes revealing seemingly incongruous situations. For example, in China, there is a large physical transfer of water from the water-rich south to water-scarce north. This water is used both for arid northern cities such as Beijing, and also to produce food, which in turn is then exported back to the more populated south. Does this back-and-forth transfer reflect the best use of resources, or could production of food in the south make more economic sense? And what happens when drought in the south becomes more common due to climate change?
Often, government policies or local costs to use water do not reflect the realities of water scarcity and contribute to inefficient virtual water trade networks. For example, many arid regions export their scarce water in the form of crops, with an opportunity cost that is higher than the income. Dr. Strezpek tells the story of Saudi Arabia:
“Saudi Arabia (a desert country) for a time was exporting wheat. They built irrigation systems and were pumping water from the deep aquifers, basically mining the water from the groundwater. They were able to do it because there was very little cost to the farmers for the energy and no cost for the water… so they were providing all of their wheat for their bread, and actually exporting it. But when they looked at, [compared to selling the oil used to pump that water, the cost of [producing the loaf] of bread was twice what they could have paid to import it.”
The “fossil water” in these deep aquifers has typically been undisturbed for millennia; unlike shallower aquifers that are recharged by rainfall, fossil water is not replenished by natural precipitation—and like oil, when it’s gone, it’s gone.
These situations occur all over the world, often where water makes up a small cost of production. At present, in most areas around the globe, water is subsidized, underpriced, or not priced at all.
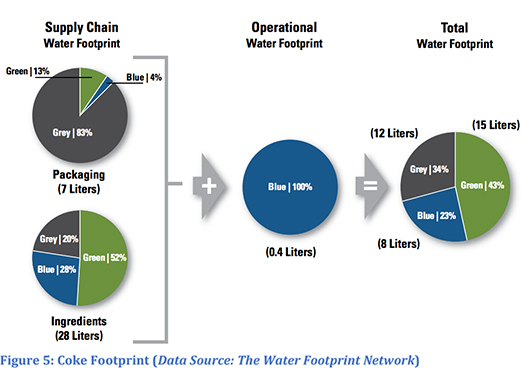
Businesses use the concept of water footprint to understand how much water is used and in which parts of their supply chains. A 0.5L of Coke requires 35L of water to produce. The majority is green water and most is used in the production of sugar. (Source: The Water Footprint Network)
Business
Many argue about the usefulness of water footprints at the national scale when so many other factors are also important (GDP, population, size, resource base, etc.). However, one application of the virtual water and water footprints methodology that many agree on is its use to businesses. Virtual water, to a business, means the amount of water used along a good’s value chain. For businesses, water footprints can reveal risk in their supply chain as well as areas where suppliers might be depleting local resources and exacerbating water scarcity. According to the Water Footprint Network: “Companies [now] realize that mismanagement of water can damage their brand, their credibility, their credit rating and their insurance costs” (Waterfootprint.org) For example, Coca-Cola produced a report assessing the water footprint for some of its products. A half-liter bottle of Coke requires 32 liters of water to produce, and most of the water use is on the farm, not in the factory. (The production of sugar is particularly thirsty, making up 87.5% of the water footprint (28 liters).) While most of the water came from green sources, eight of these liters come from less sustainable blue water. (Figure 5 – Coke Footprint) This assessment has in part informed the company’s current efforts in sustainable sugar sourcing.
Protecting an Interconnected Resource
The concept of virtual water and water footprints provides a global perspective and has the potential to inform local solutions. In an increasingly interconnected world, virtual water provides a way to understand the globalized nature of water, and highlights the varied linkages between water, food and trade. Through trade, the drivers of water scarcity can be global, but the impacts of water scarcity are felt most severely at a local level and, thus, require local solutions. Fortunately, the concept of “water footprints” can help. With a simple message to consumers to consider embedded water as part of their environmental footprint, and a toolkit for businesses and nations to understand the water impact of their policies and processes, virtual water and water footprints can help us all become better stewards of the environment.
---
Works Cited
Conant, E. (2006). Return of the Aral Sea | DiscoverMagazine.com. [online] Discover Magazine. Available at: http://discovermagazine.com/2006/sep/returnaralsea [Accessed 20 Jun. 2018].
Falkenmark, M. and Rockström, J. (2006). The New Blue and Green Water Paradigm: Breaking New Ground for Water Resources Planning and Management. Journal of Water Resources Planning and Management, 132(3), pp.129-132.
Gawel, E. and Bernsen, K. (2013). What is wrong with virtual water trading? On the limitations of the virtual water concept. Environment and Planning C: Politics and Space, 31(1), pp.168-181.
Micklin, P. P. 1988. Dessication of the Aral Sea: A water management disaster in the Soviet Union. Science 241: 1170-76.