
News J-WAFS Newsletter Highlight: How much water did you eat today?
Anjuli Jain Figueroa, PhD candidate MIT Department of Civil and Environmental Engineering, MIT August 7, 2018
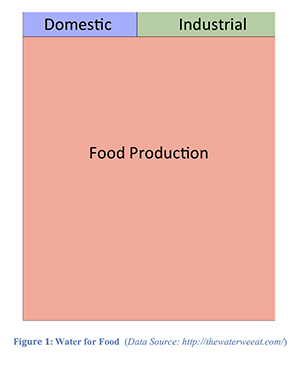
For the novice, the term “virtual water” might conjure images of a computer game or the next digital currency, but virtual water is far from a cyber term. This term emerged as a way of highlighting the intertwined nature of food production and water. After all, drinking, washing, and domestic uses of water comprise only 10% of the water consumed across the globe. The rest, nearly 90%, is devoted to food production (Figure 1 – Water for Food).
Virtual Water: A winning concept
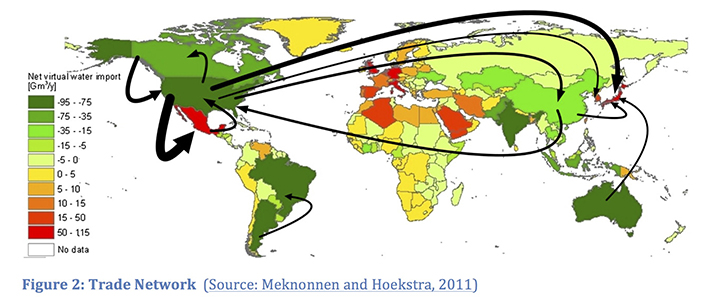
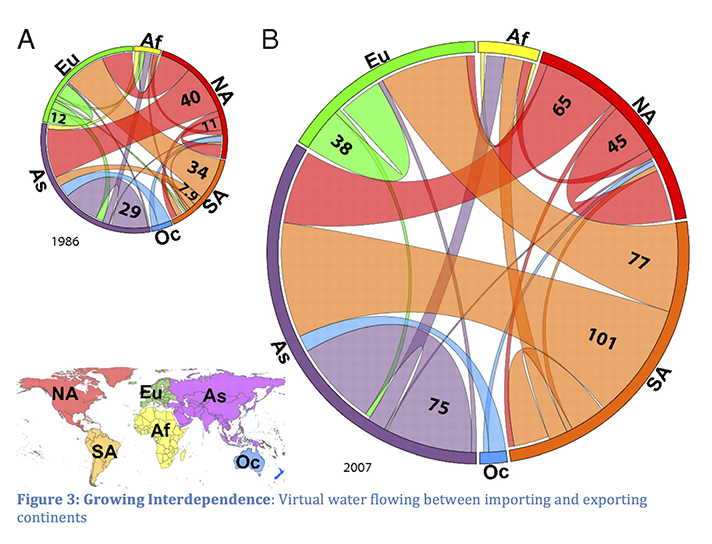
In 2008, Dr. John Anthony Allen won the Stockholm Water Prize for describing how local water scarcity could be mitigated by “virtual water” embedded in traded goods. He explained why some arid and water-stressed regions of the Middle East had not had the water wars predicted by doomsayers. These regions were securing water and food by importing water-intensive products instead of producing them locally. As Dr. Allen stated, “More water ‘flows’ into the Middle East each year as ‘virtual water’ embedded in grain than flows down the Nile into Egypt for agriculture.” (Allen 1997) Later, Hoekstra and Mekonnen (2011) quantified the virtual water flows between nations, revealing global net importers and exporters (Figure 2 – Trade Network). Dalin et al. (2012) further showed that the volume of water associated with global food trade has more than doubled in 22 years from 1987 to 2007, further emphasizing the growing interdependence of nations on the resources and water supply in other regions.
Water Footprints: from the global to local
Related to virtual water is the term “water footprint.” While virtual water emphasizes water for production, the water footprint emphasizes water for consumption. A water footprint can be calculated for a nation, a business, or an individual, and is useful for comparing demands. The Water Footprint Network provides guidelines and best practices for standardizing the accounting, since the water required for growing food can depend on several factors, such as crop variety, length of growing period, and climatic zones.
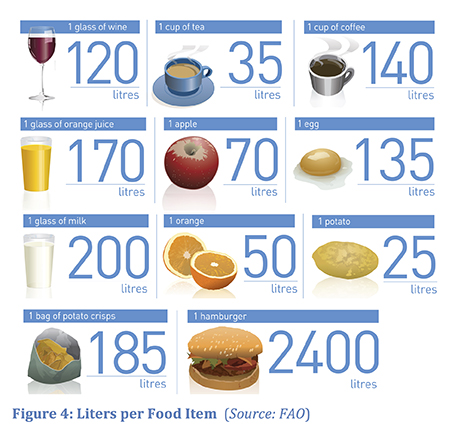
The water footprint provides a general way to compare how water-intensive food products are (Figure 4 – Liters per Food Item). Beef is one of the most water-intensive foods. One pound of boneless beef requires about 2,300 liters of water to produce. If you’re eating a hamburger, adding buns and cheese raises the water footprint to 2,400L. Nearly 95% of beef’s water footprint comes from the irrigated forage crops and fodder used to raise cattle. When a bull or cow converts grains into protein over the two years to maturity, the cumulative resources (feed and associated water) can add up quickly. Consequently, a meat-eating person consumes an average of 5000 liters of virtual water per day, while the average vegetarian requires only half this amount.
Looking at the water footprint alone may not capture all of the necessary elements to serve as an indicator of sustainability. As an analogy, a nutrition label in which only one ingredient is considered, like sugar, may not be enough to tell you if the food is healthy; sodium, fat, or vitamins, whether excessive or deficient, also play a role.
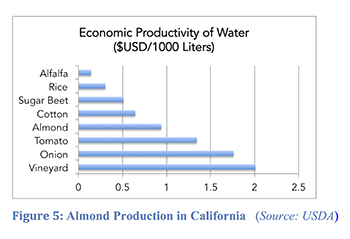
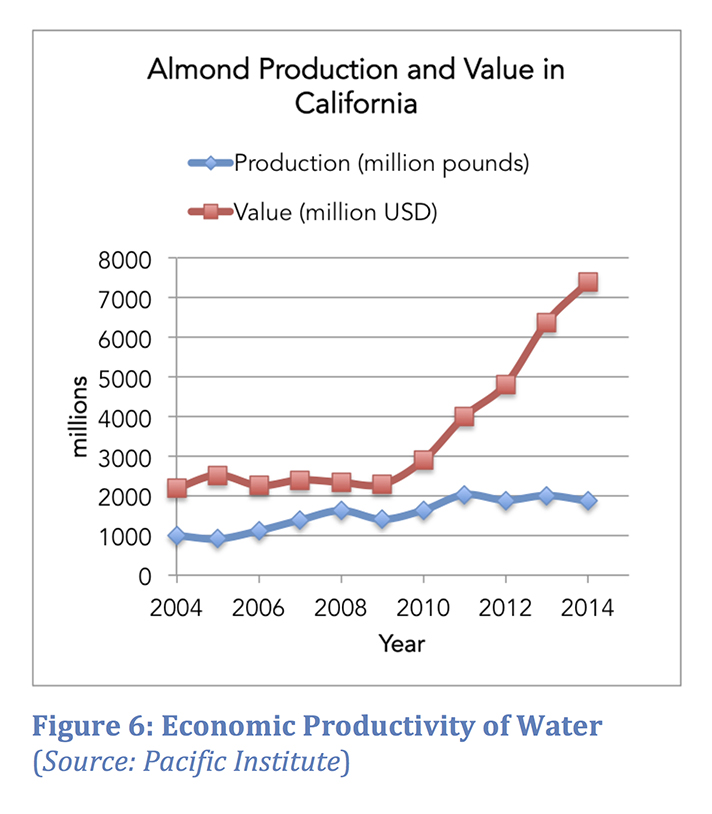
The issues related to virtual water are complex. For example, in California, every drought stimulates the debate regarding the sustainability of growing 80% of the world's almonds, a water-intensive crop, when they are grown at the expense of other local water needs. It takes about four liters of water to produce one almond (Johnson and Cody, 2015). The reason? Almond orchards must be watered year-round, even when they are not yet bearing fruit. Despite this concern, production of almonds increased from 2004-2014 (Figure 5 – Almond Production in California). If it takes so much water, why would famers grow almonds in a water-scarce location? Figure 6, Economic Productivity of Water, gives a hint: almonds are a relatively high value crop, thus farmers are willing to use considerable amounts of water for the economic gains they achieve. In 2014, California’s almond industry generated an estimated $21 billion in economic value to the state.
Nonetheless, judgments about the value of water and what it should be used for can change during times of water scarcity. Therefore, it is important that water is not treated as a free raw material and is properly priced. Many researchers are looking at the tradeoffs between cash crops and food crops (for instance the J-WAFS-funded project led by Profs. Erica James and Dennis McLaughlin) and at the effectiveness of water markets that use pricing and other strategies to better reflect the value of water (such as the J-WAFS-funded project led by Prof. Chris Knittel).
Why should you care about virtual water and water footprints?
As researchers untangle the complex web of water and agriculture interactions, what can you as an individual do? There is perhaps one action agreed upon by most: reducing meat consumption. The GRACE Communications Foundation, a non-profit aimed at alerting the public to issues around food, water, and energy puts it this way: to save water, eat lower on the food chain, eat less meat (especially beef), and don’t waste food.
Meat is a very resource-intensive product on several metrics. In California, for example, alfalfa and pasture for animal feed is the single largest water user (even more than the almonds). In 2010, alfalfa consumed 6,400 billion liters while almonds consumed 4,700 billion. Though water-intensive, alfalfa is low in value, even though it supports the beef industry.
Consuming less meat improves health and reduces carbon as well as water footprints. This topic came up in the May 2018 J-WAFS expert workshop on climate change, agriculture, water, and food security. Professor Peter Smith of the University of Aberdeen, in Scotland, focused his talk on the importance of dietary choices, and the potential positive environmental returns that could come about as a result of changing consumption patterns. Commenting on the large and growing water and environmental impact of beef production, he commented that, “once you reduce red meat consumption [worldwide], that lets us imagine demand for other, more sustainable products [that could meet current and future food needs].”
Moving forward
The concept of virtual water enables us to understand that the choices we make, whether as an individual, a business, or a nation, can have an effect on the environment and the resources far beyond our immediate vicinity. As population grows and wealth levels increase, as nations become more interdependent, and as diets change, it is useful to know how much virtual water you as an individual consume. So at your next meal, ask yourself: how much water did you eat today?
- - -
Figure Captions
Figure 1 – Water for Food: Most water (-3500 liters per person per day) is used for food production. Only 140 liters per day is used for domestic needs and 170 liters per day for industrial needs. (Data Source: http://thewaterweeat.com/)
Figure 2 – Trade Network: Substantial amounts of virtual water crosses borders as water embedded in food. The water balance and direction of gross virtual water for 1996-2005 is shown with net exporters (green) and net importers (yellow, orange, red) (Source: Meknonnen and Hoekstra, 2011).
Figure 3 – Growing Interdependence: Virtual water flows in km3 have doubled from A) 1986 (259 km3) to B) 2007 (567 km3) among six world regions depicted in the map key. To understand the figure, follow the arcs that connect the regions. It shows how South America and North America are net exporters, Africa, in another example, is a net importer.
Figure 4 – Liters per Food Item: The water footprint for various products shows that fresh fruits and vegetables require less water than processed foods like chips. Meat and hamburgers have the highest water footprint and are the most water intensive (Source: FAO).
Figure 5 – Almond Production in California: Almond production (and harvest areas) in California increased from 2004 to 2014. The value of almonds over the same period increased much faster, reflecting their growing economic value. (Data Source: 2017 California Almond Acreage Report (April 25, 2018, https://www.nass.usda.gov/Statistics_by_State/California/Publications/Specialty_and_Other_Releases/Almond/Acreage/201804almac.pdf)
Figure 6 – Economic Productivity of Water: Farmers make decisions about crop types based on several factors, including economic conditions and water availability. While these values provide insight into farmer’s choices, agricultural decisions are not based on one metric alone. (Data Source: Pacific Institute, https://www.pacinst.org/wp-content/uploads/2015/04/CA-Ag-Water-Use.pdf)
- - -
Works Cited
Allen, T. (1997). ‘Virtual water’: a long term solution for water short Middle Eastern economies? University of Leeds: British Association Festival of Science. Available at: https://www.soas.ac.uk/water/publications/papers/file38347.pdf [Accessed 20 Jun. 2018].
Dalin, C., Konar, M., Hanasaki, N., Rinaldo, A. and Rodriguez-Iturbe, I. (2012). Evolution of the global virtual water trade network. Proceedings of the National Academy of Sciences, 109(16), pp.5989-5994.
Falkenmark, M. and Rockström, J. (2006). The New Blue and Green Water Paradigm: Breaking New Ground for Water Resources Planning and Management. Journal of Water Resources Planning and Management, 132(3), pp.129-132.
Hoekstra, A. and Mekonnen, M. (2012). The water footprint of humanity. Proceedings of the National Academy of Sciences, 109(9), pp. 3232-3237.
Johnson, R. Cody, B. (2015) California Agricultural Production and Irrigated Water Use. Congresional Research Service. https://fas.org/sgp/crs/misc/R44093.pdf
Waterfootprint.org. (2018). Business water footprint. [online] Available at: http://waterfootprint.org/en/water-footprint/business-water-footprint/ [Accessed 20 Jun. 2018].